Brighton, UK
September
22-23

|
|
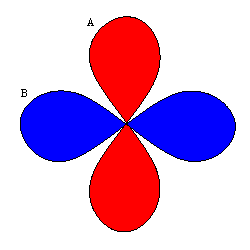
Euler Diagrams
2004 Brighton, UK September
22-23 |
|
Home | Call for papers | Submissions | Registration | Programme | Local arrangements | Euler diagrams | Brighton
Leonhard Euler (pronounced "Oiler") was one of greatest mathematicians of all time. Many people claim he was the greatest. One of his lesser known inventions is Euler diagrams, which he used to illustrate reasoning.
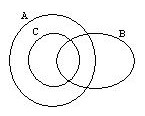
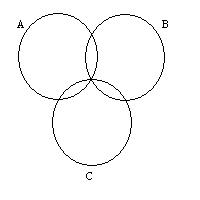
An Euler diagram is shown above. One of the common interpretations of Euler diagrams is that of set intersection. With this interpretation, the above diagram uses areas to represent sets A, B and C. The diagram also includes areas for the intersections AÇB, AÇC, and AÇBÇC. No area represents the set (not A)ÇC and so the set C is entirely contained in A.
Visually, Euler diagrams consist of contours, drawn as simple closed curves. The contours split the plane into zones. A zone can be identified by its containing contours. In the diagram above, the contours are labelled A, B and C and the zones A, B, AB, AC and ABC are present in the diagram (as well as the outside zone which is contained in no contours). Here we associate with each zone a label formed from the contours within which it is contained.
The terms Euler diagram and Venn diagram are often confused. Venn diagrams can be seen as a special case of Euler diagrams, as Venn diagrams must contain all possible zones, whereas Euler diagrams can contain a subset of all possible zones. In Venn diagrams a shaded zone represents an empty set, whereas in an Euler diagram the corresponding zone could be missing from the diagram. This means that as the number of contours increase, Euler diagrams are typically less visually complex than the equivalent Venn diagram, particularly if the number of non-empty intersections is small.
Baron [Bar69] notes that Leibniz produced similar diagrams before Euler, however, much of it was unpublished. She also observes even earlier Euler-like diagrams by Ramon Lull in the 13th Century.
Notes on the competing diagram types can be found at: Wikipedia, Interactive Mathematics Miscellany and Puzzles and Frank Ruskey's Venn Diagram Survey.
This section shows a few examples of where Euler diagrams can be used. Often, Euler diagrams are augmented with extra structures, such as dots, labels or graphs, showing information about what is contained in the various zones.
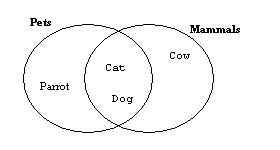
One significant feature of Euler diagrams is their capacity to visualize complex hierarchies. Above is a picture indicating that some animals are in more than one classification, such as "dog" and "cat" which are both pets and mammals. It is not easy to show this sort of relationship with the more usual tree based hierarchical visualization of classifications. VENNFS [CES03] takes this Euler diagram approach to visualizing file system organization. It allows files to appear in more than one directory in a computer file system. [VV04] propose using Euler diagrams to visualize large databases using multiple classifications.
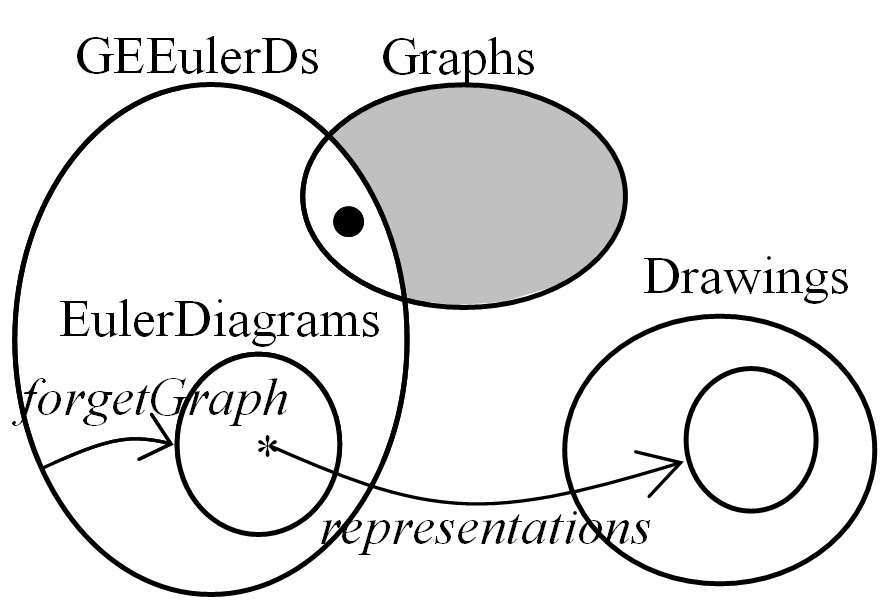
The original application of Euler diagrams, as a way of diagrammatically demonstrating logic, is widely used in schools, where they are a great aid to teaching set theory. More academic work includes Hammer [Ham95], who introduced a sound and complete logical system based on Euler diagrams. More expressive reasoning can be achieved by extending the diagrams with graphs. Shin [Shi94] developed the first such formal system. This was extended to Spider [HMTKG01] and Constraint diagrams [GHK01] by the Visual Modelling Group at the University of Brighton, along with others. An example constraint diagram is shown above. These enhanced Euler diagrams can be seen as hypergraphs, and as such, it should be possible to apply visualization techniques for enhanced Euler diagrams more generally to applications that use hypergraphs.
Much of the recent research has looked at embedding Euler diagrams in the plane from a textual description of the zones that should appear in the diagram. This work is made more interesting by the presence of wellformedness conditions. Wellformedness restricts the appearance of Euler diagrams, and so to some extent, the more wellformed, the better the comprehension of the diagram. However, some Euler diagrams are not drawable under some wellformedness conditions. Common wellformedness conditions are:
Relaxing these restrictions allows all Euler diagrams to be drawn. Euler himself only drew diagrams with circles, without breaking any of the wellformedness conditions.
Some examples of wellformedness:
| 1. This diagram is Venn 4 (The Venn diagram with 4
contours), drawn with non convex contours. This diagram can be drawn with
convex shapes.
|
 |
| 2. This diagram, representing zones A, B, C, AB, AC and BC (but
not ABC) has got a triple point. This diagram cannot be drawn without
breaking wellformedness rules 2, 5 or 6.
|
 |
| 3. This is an example of a non-transverse diagram representing the zones A and B. |  |
| 4. This is a diagram representing the zones AB, AC. The
visualization requires shared curve segments.
|
 |
| 5. In these diagrams, areas with the same colour represent the same zone. The diagram on the left has disconnected zones. The diagram on right has the same semantics as the one on the left, but is wellformed. Disconnected zones are particularly troublesome where items are intended to be grouped in zones. If diagrams like those on the left were used, then two items that were intended to be grouped together could appear in different sections of the diagram, even though the semantics of the diagram would be correct. | 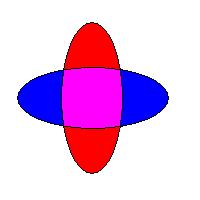 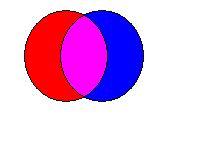 |
| 6. This is a diagram of zones A and B, represented with
non-simple curves.
|
 |
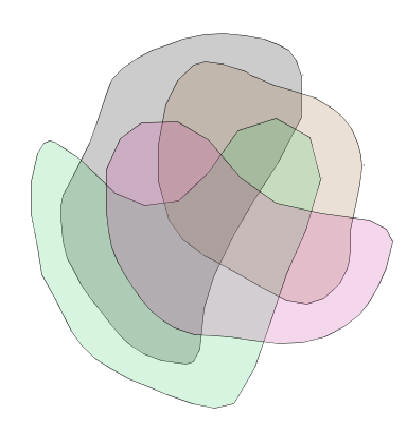
The first work on automatically generating Euler diagrams was by Flower and Howse [FH02], who proposed and implemented a method for drawing a subset of diagrams maintaining all wellformedness conditions except 1, below on the left is a diagram generated by this method. Further work by Chow and Ruskey [CR03], described an implemented method for embedding small diagrams with restrictions on the shape of the contours, including shapes built from rectangles. Verroust and Viaud [VV04] have proposed a system for drawing all Euler diagrams up to 8 contours, relaxing wellformedness rules 1,2,3 and 4.
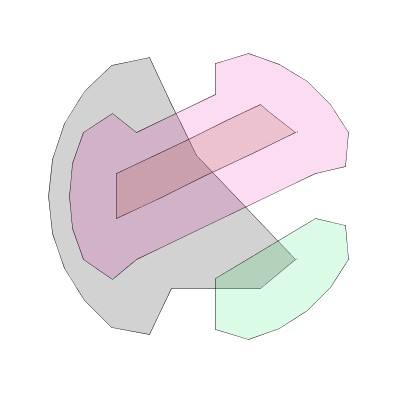
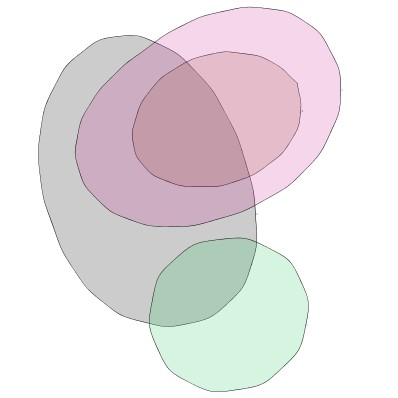
This relates to drawing Euler diagrams with regard to their aesthetic appearance. The generating methods described in the previous section often produce difficult to comprehend Euler diagrams. Our recent research [FRM03] has taken Euler diagrams generated by [FH02] and applied aesthetic metrics to the contours in an effort to make the diagrams more comprehensible, see above for a before and after picture. This was then extended to draw graphs in Euler diagrams [MRF04].
If you spot an error, or have something to add to this page, please contact: Peter Rodgers.
Stanford
Encyclopaedia of Philosophy has a detailed summary and comparison of diagram
types
Examples of
using Euler diagrams in logical reasoning
Wikipedia Entry on Venn and Euler
diagrams
Venn
vs. Euler
A Venn Diagram
Survey by Frank Ruskey
[Bar69] M. E. Baron. A Note on The
Historical Development of Logic Diagrams. The Mathematical Gazette: The Journal
of the Mathematical Association. Vol LIII, no. 383 May 1969.
[CES03] R. De Chiara, U Erra and V. Scarano.
VENNFS: A Venn-Diagram File Manager. Proc. IEEE Information Visualization
(IV03). pp. 120-126. 2003.
[CR03] S. Chow and F.
Ruskey. Drawing Area-Proportional Venn and Euler Diagrams. Proc. GD2003. LNCS
2912. Springer Verlag.
[Eul61] L. Euler. Lettres a Une Princesse d’Allemagne, vol 2. 1761. Letters No.
102–108.
[FH02] J. Flower and J. Howse. Generating
Euler Diagrams, Proc. Diagrams 2002, Springer Verlag, 61-75.
[FRM03] J. Flower, P. Rodgers and P. Mutton. Layout Metrics
for Euler Diagrams. Proc. IEEE Information Visualization (IV03). pp. 272-280.
2003.
[GHK01] J. Gil, J. Howse and S. Kent.
Towards a Formalization of Constraint Diagrams, Proceedings of Human-Centric
Computing (HCC 2001) Stresa, Italy, IEEE Computer Society Press, 72-79.
2001.
[Ham95] E. M. Hammer. Logic and Visual
Information, CSLI Publications. 1995.
[HMTKG01]
J. Howse, F. Molina, J. Taylor, S. Kent and J. Gil. Spider Diagrams: A
Diagrammatic Reasoning System, Journal of Visual Languages and Computing 12,
299-324. 2001
[MRF04] P. Mutton, P. Rodgers and J.
Flower. Drawing Graphs in Euler Diagrams. Proc. Diagrams 2004. LNAI 2980.
Springer Verlag. 66-81.
[Shi94] S-J Shin. The
Logical Status of Diagrams. CUP. 1994.
[Ven80] J.
Venn, On the diagrammatic and mechanical representation of propositions and
reasonings, The London, Edinburgh, and Dublin Philosophical Magazine and Journal
of Science, 9 (1880) 1-18.
[VV04] A. Verroust and
M.-L. Viaud. Ensuring the Drawability of Extended Euler Diagrams for up to 8
Sets. Proc. Diagrams 2004. LNAI 2980. Springer Verlag. 128-141.